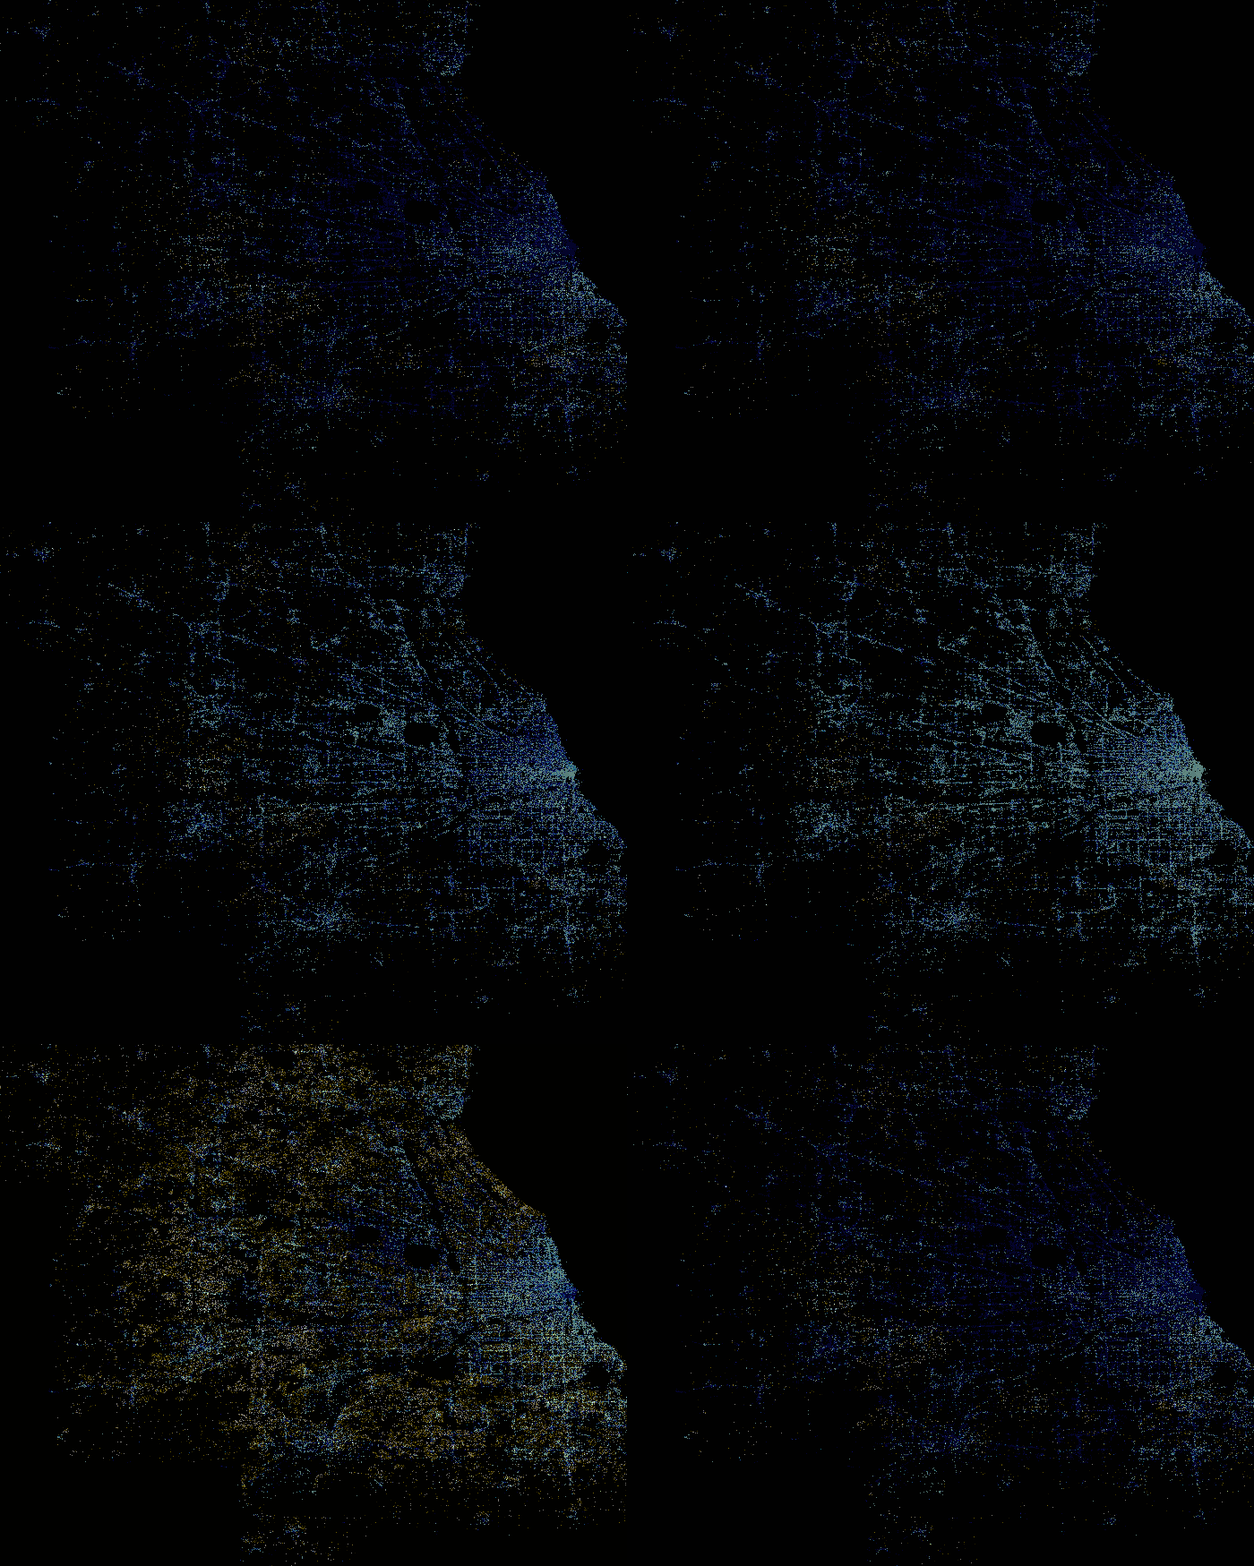
through the lens of electricity usage
My main hypothesis here is that changes in electric usage are great proxies for human activity, and this can ultimately be used to measure interaction between humans and the infrastructure
Electricity usage captures patterns of movement and behavior across different times and locations. By analyzing electricity consumption at a granular level—such as residential, commercial, and industrial demand—researchers can infer activity density, work schedules, and peak usage times, which often align with commuting patterns. For instance, morning spikes in residential electricity use followed by declines as people leave for work can be correlated with transit ridership surges. Similarly, commercial electricity consumption peaks during business hours can help refine models of employment-driven mobility. By integrating these electricity consumption trends with transportation data, we can improve predictive models for transit ridership, travel demand, and even urban resilience planning, ultimately leading to smarter and more adaptive infrastructure systems.
This is an ongoing effort, and the first publications on it are already under review.
In the meantime, please enjoy this visualization of nearly 4 million data points in Chicago representing energy use intensity. Commercial use is depicted in blue, while residential is depicted in yellow.
